Fisher's Exact Test (Enrichment Analysis)
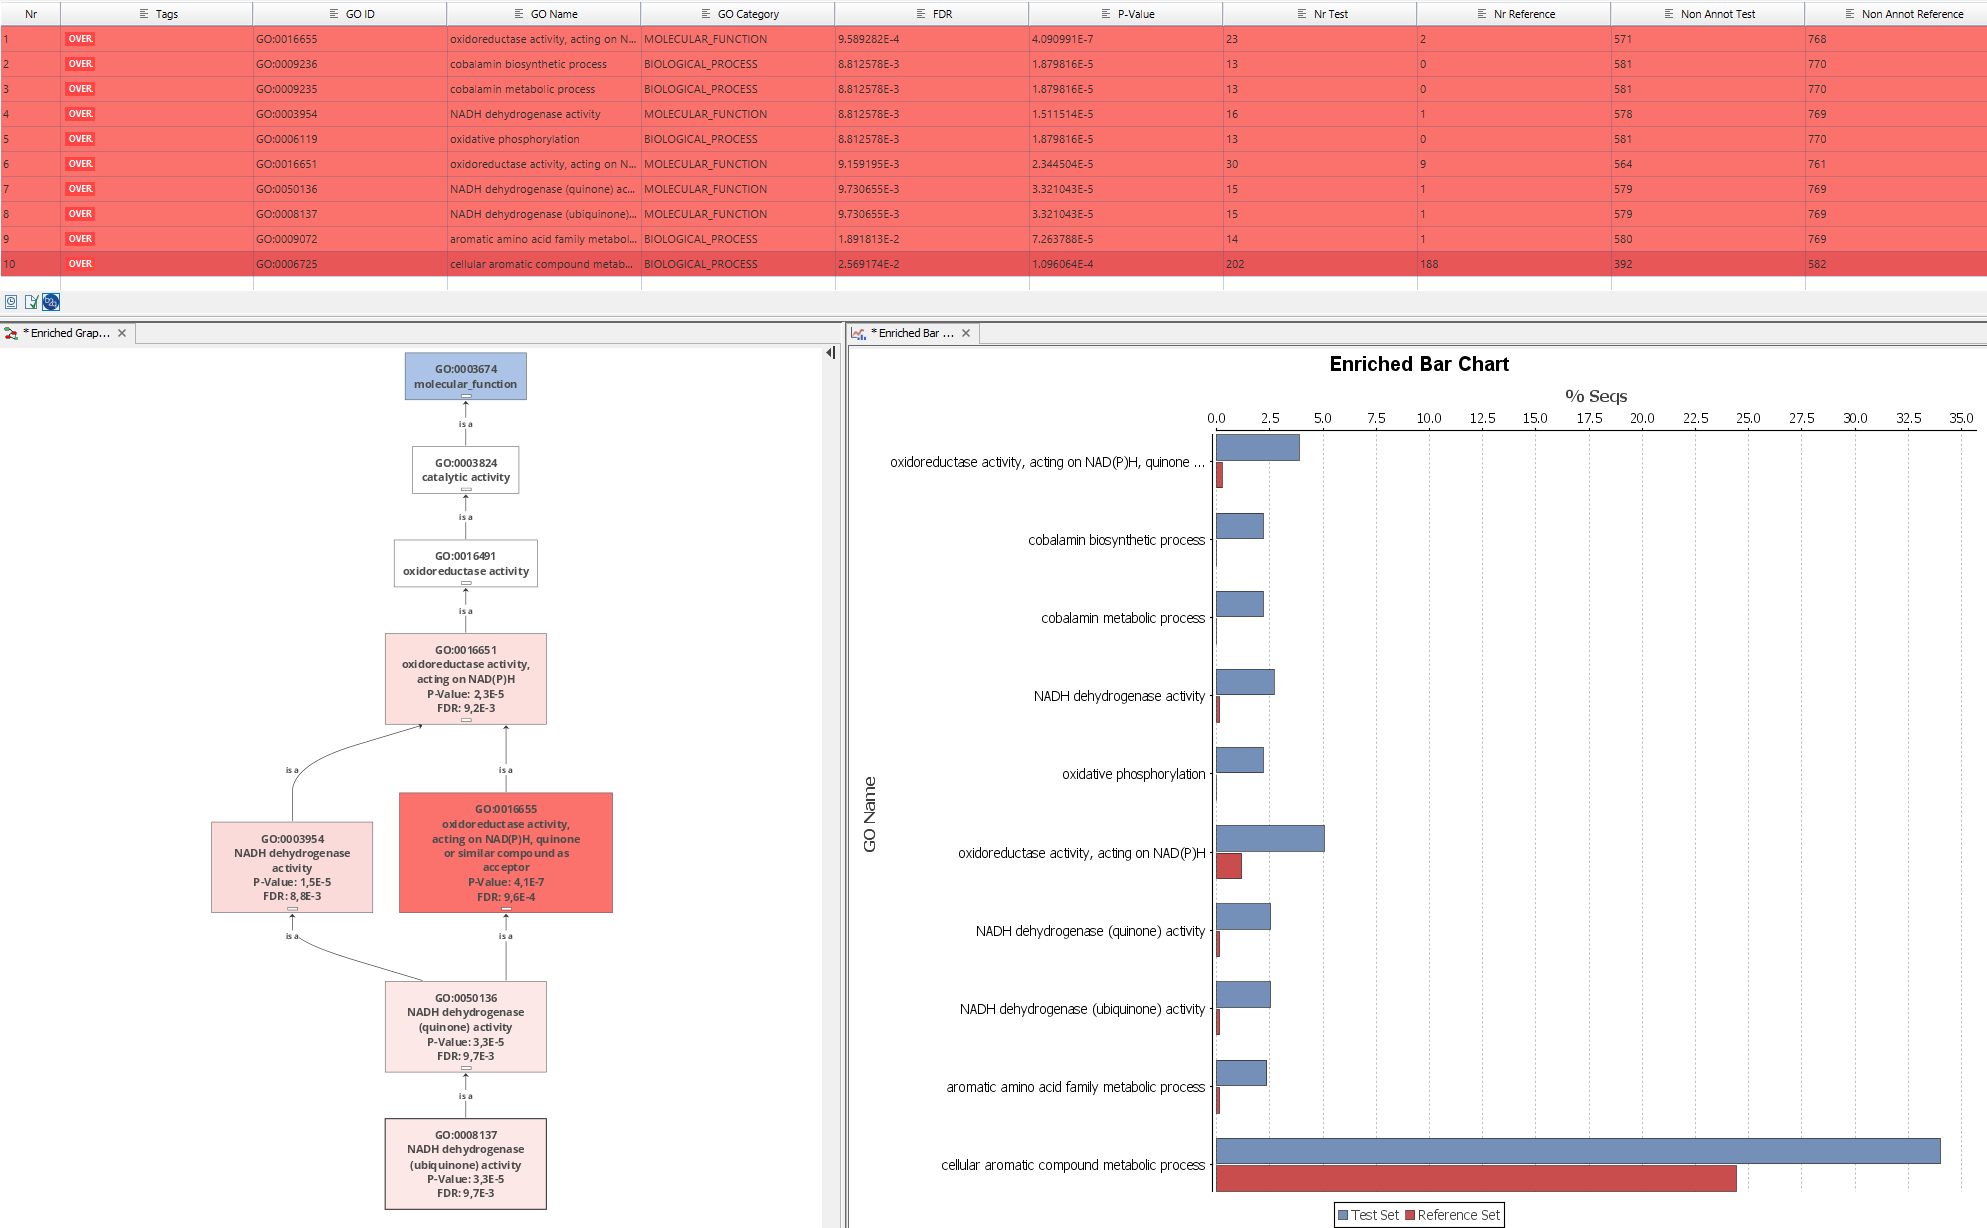
Blast2GO offers the possibility of direct statistical analysis on gene function information. A common analysis is the statistical assessment of GO term enrichment in a group of interesting genes when compared to a reference group i.e. to asses the functional differences between two sets of functional annotations (e.g. GO function of two groups of genes). This analysis is typically performed by a Fisher's Exact Test in combination with a robust False Discovery Rate (FDR) correction for multiple testing. Fisher's exact test is a statistical significance test used in the analysis of contingency tables. Although in practice it is employed when sample sizes are small, it is valid for all sample sizes. It is named after its inventor, R. A. Fisher. The false discovery rate (FDR) control is a statistical method used in multiple hypothesis testing to correct for multiple comparisons. In a list of statistically significant findings FDR is used to control the expected proportion of incorrectly rejected null hypotheses ("false discoveries"). Here a Benjamini-Hochberg correction is used. The result is a list of statistically significant Gene Ontology terms ranked by their adjusted p-values. Results can be viewed in several different ways like tabular format, directly visualized on the Gene Ontology Graph or as a bar chart, always coloring statistically significant terms in red (over-represented) and green (under-represented).
Run a Fisher's Exact Test
To perform the test we need to have a Blast2GO Project which contains the functional information of all sequences/genes to be included in the statistical test. Now we need to select the test and reference set, this is done by indicating ID Lists that contain the sequence ids (gene). Providing a reference set is optional and if no reference is selected, the
The calculation of the p-values for all functions can take several minutes, depending on the size of the dataset and network connection speed. Once the This table lists the adjusted p-values of the Fisher's Exact Test for each GO term.
Parameters
- Annotations
Select a Blast2GO Project which contains the functional information of all sequences/genes included in the statistical test (test and/or ref-set). - Test and Reference-Set
Select a Test-Set from the navigation area. Please note that the given IDs have to match the sequence names of the Blast2GO Project selected in Annotations. The most convenient way to create ID-lists is to open the Annotations project and to select the desired sequences by hand. Once selected, right-click into the Sequence Name column and select Create ID-List of Column: SeqName. The resulting list can be selected either as Test or Reference-Set An example can be found in the Blast2GO example data-sets.
The reference-set is optional and the whole annotations set selected in the first parameter will be used otherwise. - GO Categories
Decide for which GO Category you want to perform this test. - Two Sided
In statistical significance testing, a one-tailed test or two-tailed test are alternative ways of computing the statistical significance of a data set in terms of a test statistic, depending on whether only one direction is considered extreme (and unlikely) or both directions are considered extreme. This translates to over- and under-represented Gene Ontology functions in the test-set compared to a reference set. A two tailed test means therefore to test for over- and under-representation at the same time. Note: The correction for multiple testing (FDR) is higher in a two tailed test and therefore it is less likely to detect significant results since the number of performed test is doubled. - Remove Double IDs
This options allows you to automatically remove all sequences/gene-ids which are present in the test-set and in the reference set at the same time. By default double/common IDs are only removed from the reference set.
Reduce to most specific terms
This function allows to reduce the size of the result-set of over-represented GO terms; useful in case of a very large list of enriched GO terms. In many cases, reported enriched functions have a parent-child relationship and therefore these terms represent the same functional concept but at different levels of specificity. In case of large result sets it can be convenient to filter the results by removing parent terms of already existing, statistically significant, child GO terms. In this way only a reduced list of the most specific information is reported.
