Rfam
Introduction
The Rfam database is a collection of RNA families, each represented by multiple sequence alignments, consensus secondary structures and covariance models (CMs). The families in Rfam break down into three broad functional classes: non-coding RNA genes, structured cis-regulatory elements and self-splicing RNAs. Typically these functional RNAs often have a conserved secondary structure which may be better preserved than the RNA sequence. The CMs used to describe each family are a slightly more complicated relative of the profile hidden Markov models (HMMs) used by Pfam. CMs can simultaneously model RNA sequence and the structure in an elegant and accurate fashion (Rfam description from: http://rfam.xfam.org/).
This functionality can be found under Toolbox > Blast2GO > Rfam > Rfam. It may take a while depending on the number of sequences and the EMBL-EBI servers.
Figure 1: Rfam Table Results
Results Table
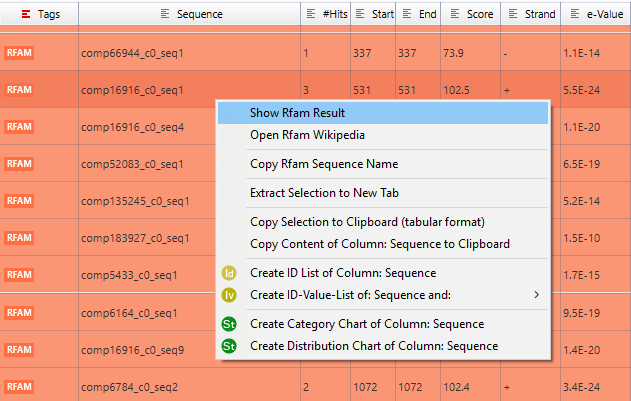
Once Rfam analysis has begun a table with the corresponding results will be displayed in a new tab. Sequences will turn red/orange depending if Rfam found hits for them (red if no hits were found, orange otherwise). White rows are sequences that have not been analysed yet. For each sequence It is possible to consult details about each one of their hits using the context menu (similar to consult Blast results).
The obtained results can be exported via the GWB Standard Export functionality in Blast2GO GFF format.
Graphical Representation of the Results
Multiple charts are available from the Rfam toolbox.
Hit Distribution: This chart shows a distribution chart of the number sequences with hits in the Rfam analysis.
Biotypes Pie Chart: This pie chart shows the distribution of the Rfam families of the sequences.
Biotypes Distribution: The same as the former but in a bar-style.
E-Value Distribution: This chart plots the distribution of E-values for the Rfam hits.
Figure 2: Rfam Statistics Graphs and Visualization


