Statistics
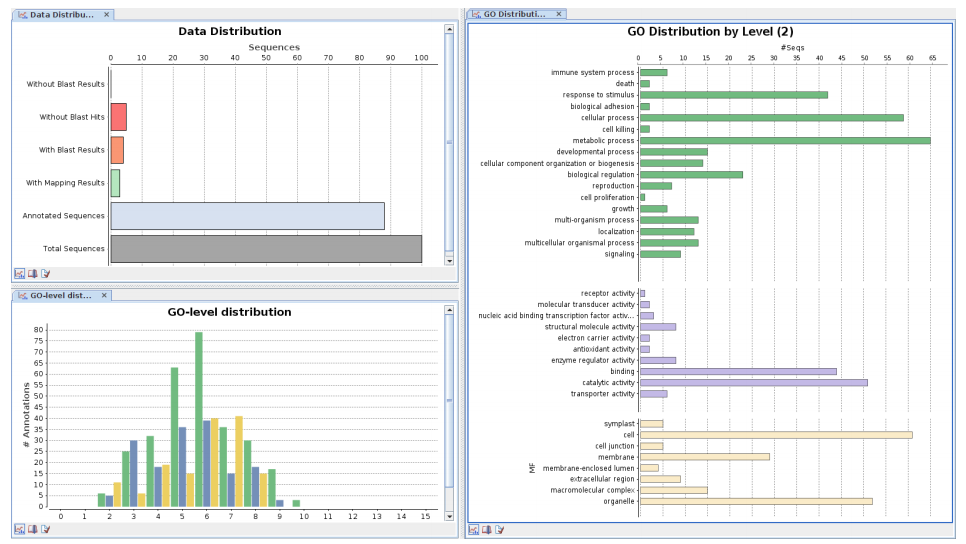
The Statistics wizard allows to select and generate all available charts in one run. Statistical charts are available to provide direct feedback about data composition. Charts such as mean sequence length, involved species distribution, BLAST e-value distribution or the standard deviation of GO level annotation distribution, allow the visualisation of intermediate and final result summaries. These charts are especially helpful to validate the results of each analysis step and to re-adjust or determine the parameters of subsequent processing. In this interactive manner the annotation process can be adjusted to specific data-set and user requirements.
List of all available statistical charts in Blast2GO
Project
- Analysis Progress:
Gives an overview about the current analysis progress of the data-set. - Data Distribution:
This bar chart shows the distribution of un-blasted, blasted, mapped and annotated sequences over the whole data-set. - Data Distribution (pie):
The same as the former but pie-style. - Sequence Length:
Plots the sequence length for all sequences.
Blast
- E-value distribution:
This chart plots the distribution of E-values for all selected BLAST hits. It is useful to evaluate the success of the alignment for a given sequence database and help to adjust the Evalue cutoff in the annotation step. - Hit Distribution:
Shows the distribution of hits for each sequence (Blast Result). - Hsp Distribution:
This bar chart shows the distribution of hsps per hit. - Hsp/Seq Distribution:
This chart shows a distribution of percentages which represents the coverage between the hsps and their corresponding sequences. - Hsp/Hit Distribution:
Same as above but for hits instead of sequences. - Sequence similarity distribution:
This chart displays the distribution of all calculated sequence similarities (percentages), shows the overall performance of the alignments and helps to adjust the annotation score in the annotation step. - Species distribution:
This chart gives a listing of the different species to which most sequences were aligned during the BLAST step. - Top-Blast Species distribution:
This chart gives the species distribution of the Top-BLAST hits.
Mapping
- GO Mapping Distribution:
Shows the distribution of the amount of Gene Ontology candidate terms assigned to each sequences during the GO Mapping step. - DB-source of mapping:
This chart gives the distribution of the number of annotations (GO-terms) retrieved from the different source databases like e.g. UniProt, PDB, TAIR etc. - EC Distribution for Blast Hits:
Same as above but per Blast hit. - Evidence Code distribution:
This chart shows the distribution of GO evidence codes for the functional terms obtained during the mapping step. It gives an idea about how many annotations derive from automatic/ computational annotations or manually curated ones.
Annotation
- Annotation distribution:
This chart informs about the number of GO terms assigned per sequence. - Annotation Score distribution:
A chart that shows the number of sequences per annotation score. - GO Annotation Level distribution:
TA bar chart which shows all GO terms for all 3 categories for a given GO level taking into account the GO hierarchy (parent-child relationships). - GO Distribution Level:
A bar chart which shows all GO terms for all 3 categories for GO level 2, taking into account the GO hierarchy. - Direct GO Count MF:
A chart for the Molecular Function GO category, which shows the most frequent GO terms within a data-set without taking into account the GO hierarchy. - Direct GO Count BP:
Same as above but for Biological Process. - Direct GO Count CC:
Same as above but for Cellular Component. - Number of GOs/Seq-Length:
Shows the relation between sequence length and number of GOs. - Annotated Seqs/Seq-Length:
Shows the relation between amount of annotated sequences and sequence lengths.
InterProScan
- InterProScan Results:
This chart shows the effect of adding the GO-terms retrieved though the InterProScan results. - InterProScan Families Distribution:
Distribution of IPS results by families. - InterProScan Domains Distribution:
Distribution of IPS results by domains. - InterProScan Repeats Distribution:
Distribution of IPS results by repeats. - InterProScan Sites Distribution:
Distribution of IPS results by sites. - InterProScan IDs Distribution:
Shows the number of results per IPS ID. - InterProScan IDs by Database:
Shows the number of results per IPS ID per database.
Enzyme
- Main Enzyme Classes:
Shows the distribution of the 6 main enzyme classes over all sequences. - Second Level Classes:
Same as above but for the corresponding subclass.
Annex
- This chart shows the performance of the Annex annotation augmentation step. It shows the number of GO terms which were confirmed, replaced or removed through this method.


